"Spending on learning is easy—proving it works is where reputations are made."
If you’ve ever sat in a budget review explaining why your onboarding program deserves another six-figure line item, you know the room goes quiet the moment someone asks, "What’s the return?" This guide gives you a no-nonsense roadmap—formula, frameworks, dashboards, and a real case snapshot—so you can walk into that meeting armed with numbers and a plan to make your content work even harder next quarter.
Why ROI Is the New North Star
Nearly half (49%) of learning and talent development pros say their execs worry employees lack the skills to hit business goals—up from prior years. Learning is still non-negotiable, but now the C-suite wants proof it pays off.
Add Gen AI to the mix and the stakes rise again: 79% of leaders say using AI efficiently will be critical for their organization’s competitiveness, raising the pressure to demonstrate quick ROI.
Translation: Unless you can link training to concrete business metrics, stakeholders will likely divert those dollars to projects that can.
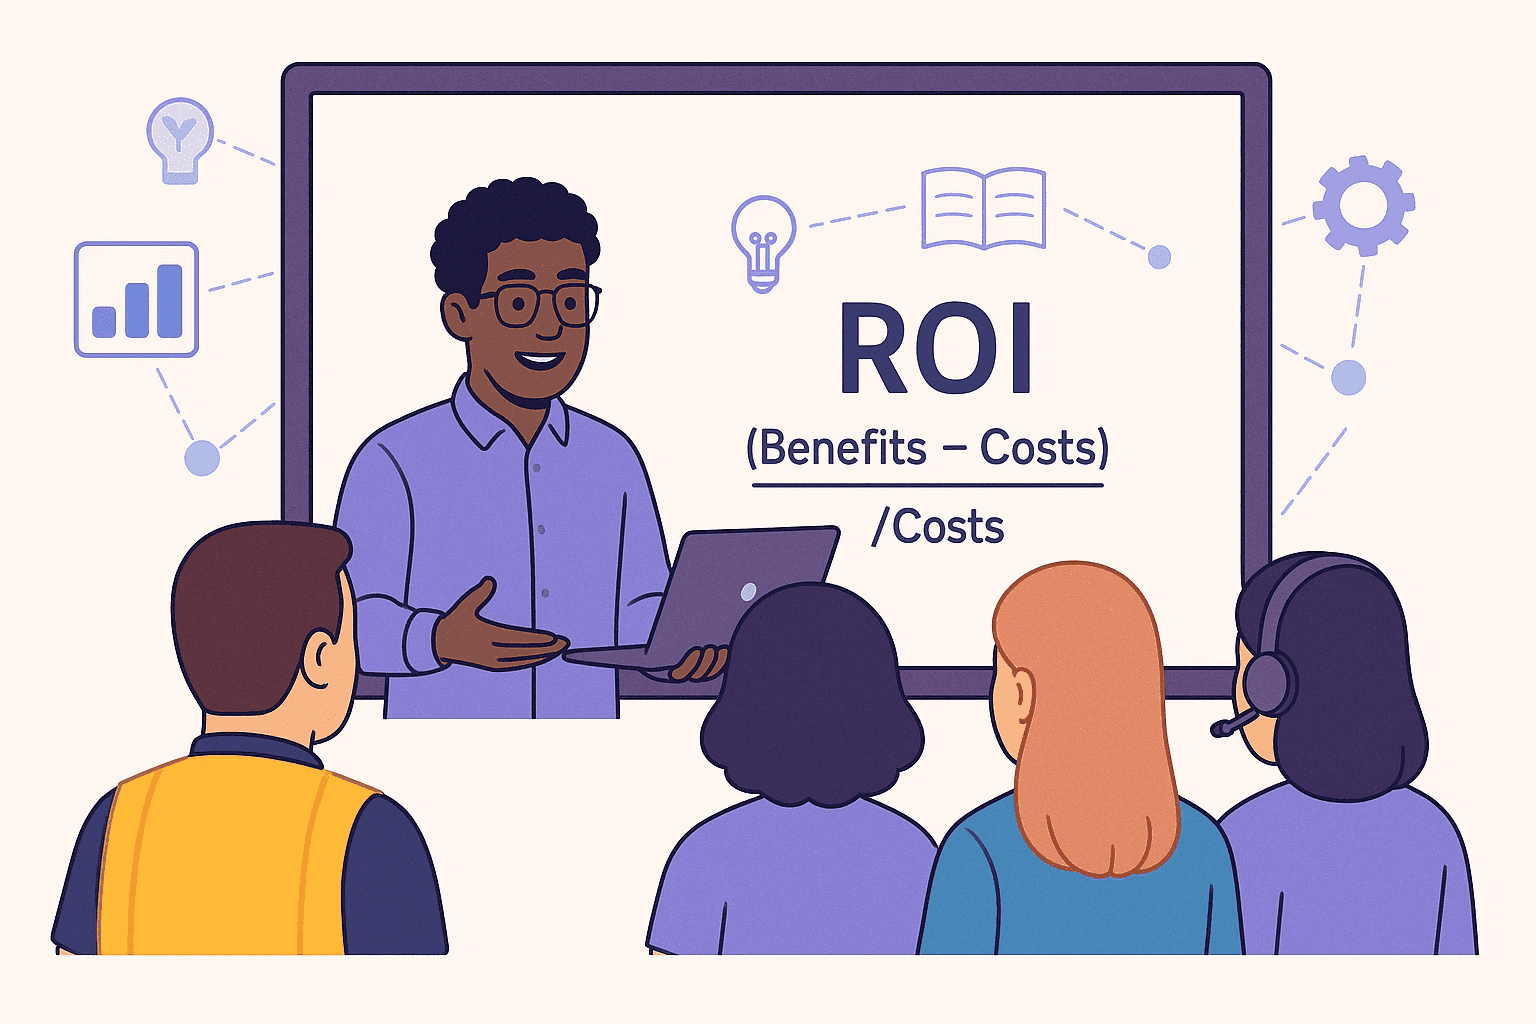
ROI 101: The Straight-Up Formula
ROI = (Benefits – Costs) ÷ Costs × 100
That’s it. The challenging part is deciding exactly what belongs in “benefits” and what belongs in “costs.”
Benefits
Typical Costs
Revenue lift, productivity gain, quality improvements, churn reduction, support-ticket deflection
Authoring & SME time, platform licenses, learner seat time, facilitation, post-launch maintenance
Quick illustration: A 30-minute sales-enablement micro-course costs $18K to build and roll out. Average deal size rises $600, and reps close one extra deal each quarter. For 120 reps, annual benefit is $288K.ROI = ($288K – $18K) ÷ $18K × 100 = 1500%. That means you earned $15 for every $1 invested—not shabby.
AIHR’s guide on measuring training ROI calls cost–benefit analysis the starting point for credible ROI calculations.
Picking Your Evaluation Lens
Choosing the right evaluation framework helps you match the depth of measurement to the size, visibility, and budget of your program. Below is a quick side‑by‑side of the two most popular models so you can pick the one that fits without over‑engineering or underselling your impact.
Model
Best When To Use
Outputs You’ll Get
Secret Sauce
Kirkpatrick 4 Levels
Quick health check on reaction, learning, behavior, and results
Survey heat‑maps, skill‑gain scores, adoption dashboards
Broad, widely understood (Kirkpatrick Partners) — applied by Georgia‑Pacific to measure remote‑leadership training impact (case study PDF, p. 46)
Phillips ROI Model
Need to show execs a dollar‑figure return and prove causality
All of the above plus a dollar‑value ROI slide, break‑even chart, isolation metrics
Adds Level 5 ROI % and isolates impact (eLearning Industry overview) — adopted by Paycom to project up to 821 % ROI for its Time‑Off Requests automation (Forrester TEI study)
Decision shortcut:
- Tight time & low stakes? Kirkpatrick.
- High-visibility program or big spend? Go Phillips.
A 5-Step Measurement Playbook
Think of this section as your fast‑track roadmap—a condensed, field‑tested sequence that moves you from planning and baseline gathering to a board‑ready ROI story. Follow these five steps and you’ll go from “we believe” to “here’s the evidence” without drowning in spreadsheets.
- Anchor objectives to business outcomes - “Increase average first‑call resolution from 72 % to 80 % by Q3” (just an illustrative target, not a universal benchmark) rather than a vague goal like “improve customer‑service skills.”
- Gather a clean baseline - Pull last-quarter KPIs, set up control groups where possible.
- Track every nickel - Use a shared spreadsheet or your finance team’s project code; don’t forget learner time (fully-loaded hourly rates matter).
- Capture benefits—tangible and intangible - Productivity and revenue are obvious. Brand lift, compliance risk reduction, and engagement scores may point to upside you’d otherwise miss. IBM’s Basic Blue leadership‑development program delivered a 2284 % ROI, according to an independent Nucleus Research analysis—driven largely by about $200 million in travel and classroom‑delivery savings.
- Run the math, tell the story - Visual dashboards beat 20-tab workbooks.
Mindsmith currently lets you export completion rates, answer distribution, and learner‑level results as a downloadable PDF report—useful when compiling your ROI metrics. Later this year, xAPI hooks (currently in beta) will enable deeper integrations with BI tools.
Advanced Metrics Worth Your Attention
Leading Indicators
Lagging Indicators
Time-to-competency (days)
Revenue per rep
Support-ticket deflection %
Quality-score lift
Simulation pass-rate
Attrition drop
At a glance: Leading indicators give you quick, “in‑the‑moment” evidence that new skills are sticking, often within days or weeks of rollout. Lagging indicators surface later—sometimes months down the line—but they prove whether training actually moved high‑stakes business metrics.
What the metrics mean:
- Time‑to‑competency (days) – average time it takes learners to reach an agreed‑upon proficiency after the program.
- Support‑ticket deflection % – share of customer issues resolved by self‑service resources (chatbots, knowledge base) instead of human agents.
- Simulation pass‑rate – percentage of participants who meet or exceed the benchmark score in a role‑play or software simulation.
- Revenue per rep – total revenue divided by the number of sales reps for the same period, showing sales efficiency.
- Quality‑score lift – improvement in quality metrics (e.g., product defect rate, audit scores) compared with the pre‑training baseline.
- Attrition drop – percentage decrease in employee turnover for the roles targeted by training.
Feeding ROI Insights Back Into Smarter Design
Once the numbers roll in, treat them as a product backlog:
- Adaptive micro-iterations → If learners bomb a scenario question, auto-generate an extra practice path.
- Branching based on role performance → High performers skip refresher modules; rookies get guided practice.
- Sunset or repurpose → Kill content that drags net ROI into the red, or slice it into micro nuggets that support a different workflow.
This continuous loop turns measurement from an annual audit into a monthly sprint heartbeat.
Case in point: Jaguar Land Rover used the Phillips ROI model to upskill 20 000 employees and partners, then leveraged the data to trim seat‑time by 25 % on follow‑up modules—proof that measuring ROI can directly guide smarter content design.
Pitfalls to Dodge
Oops
Fix
Measuring the morning after rollout
Wait for behavior/results data to accumulate (30–90 days).
Ignoring control groups
Even a small pilot vs. cohort B strengthens causality.
Treating ROI as once-and-done
Schedule quarterly tune-ups—just like a marketing funnel.
Double-counting benefits
Reconcile with Finance; shared dashboards avoid hero math.
ROI FAQs (yes, the ones your CFO will ask)
What’s a “good” ROI benchmark? Depends on risk tolerance, but anything north of 100% (i.e., program paid for itself) usually lands well. High-growth orgs often expect >300%.
How often should we recalc ROI? Quarterly for live programs; post-mortem for fixed-date rollouts.
Which tools automate the heavy lifting? BI dashboards (Power BI, Tableau), Mindsmith’s xAPI hooks, and—if you want full Phillips reporting—the ROI Institute’s templates.
Wrapping Up (and a Friendly Nudge)
Measuring ROI isn’t just financial hygiene; it’s a lens for designing sharper, leaner learning experiences. Run the numbers, spotlight what’s working, and let data steer your next content sprint.
Ready to turn analytics into action? Spin up a free Mindsmith workspace today and watch your next program move from nice-to-have to numbers-on-the-board.
Because in the end, numbers talk—and well-designed learning sings.